Our products
find here the different products shared on the plateform.
Infrastructure and resources
Two datacentres set up at OSS premises, and hosting project’s services.
Technology: Synology RackStation RS4017xs - All in one” solution (CPU + Storage)
- Datacentre for MISBAR : 140 To
- Datacentre for MISLAND : 40 To
- Fiber internet with 50 Mo (download) + 50 Mo (upload)
Operational platforms
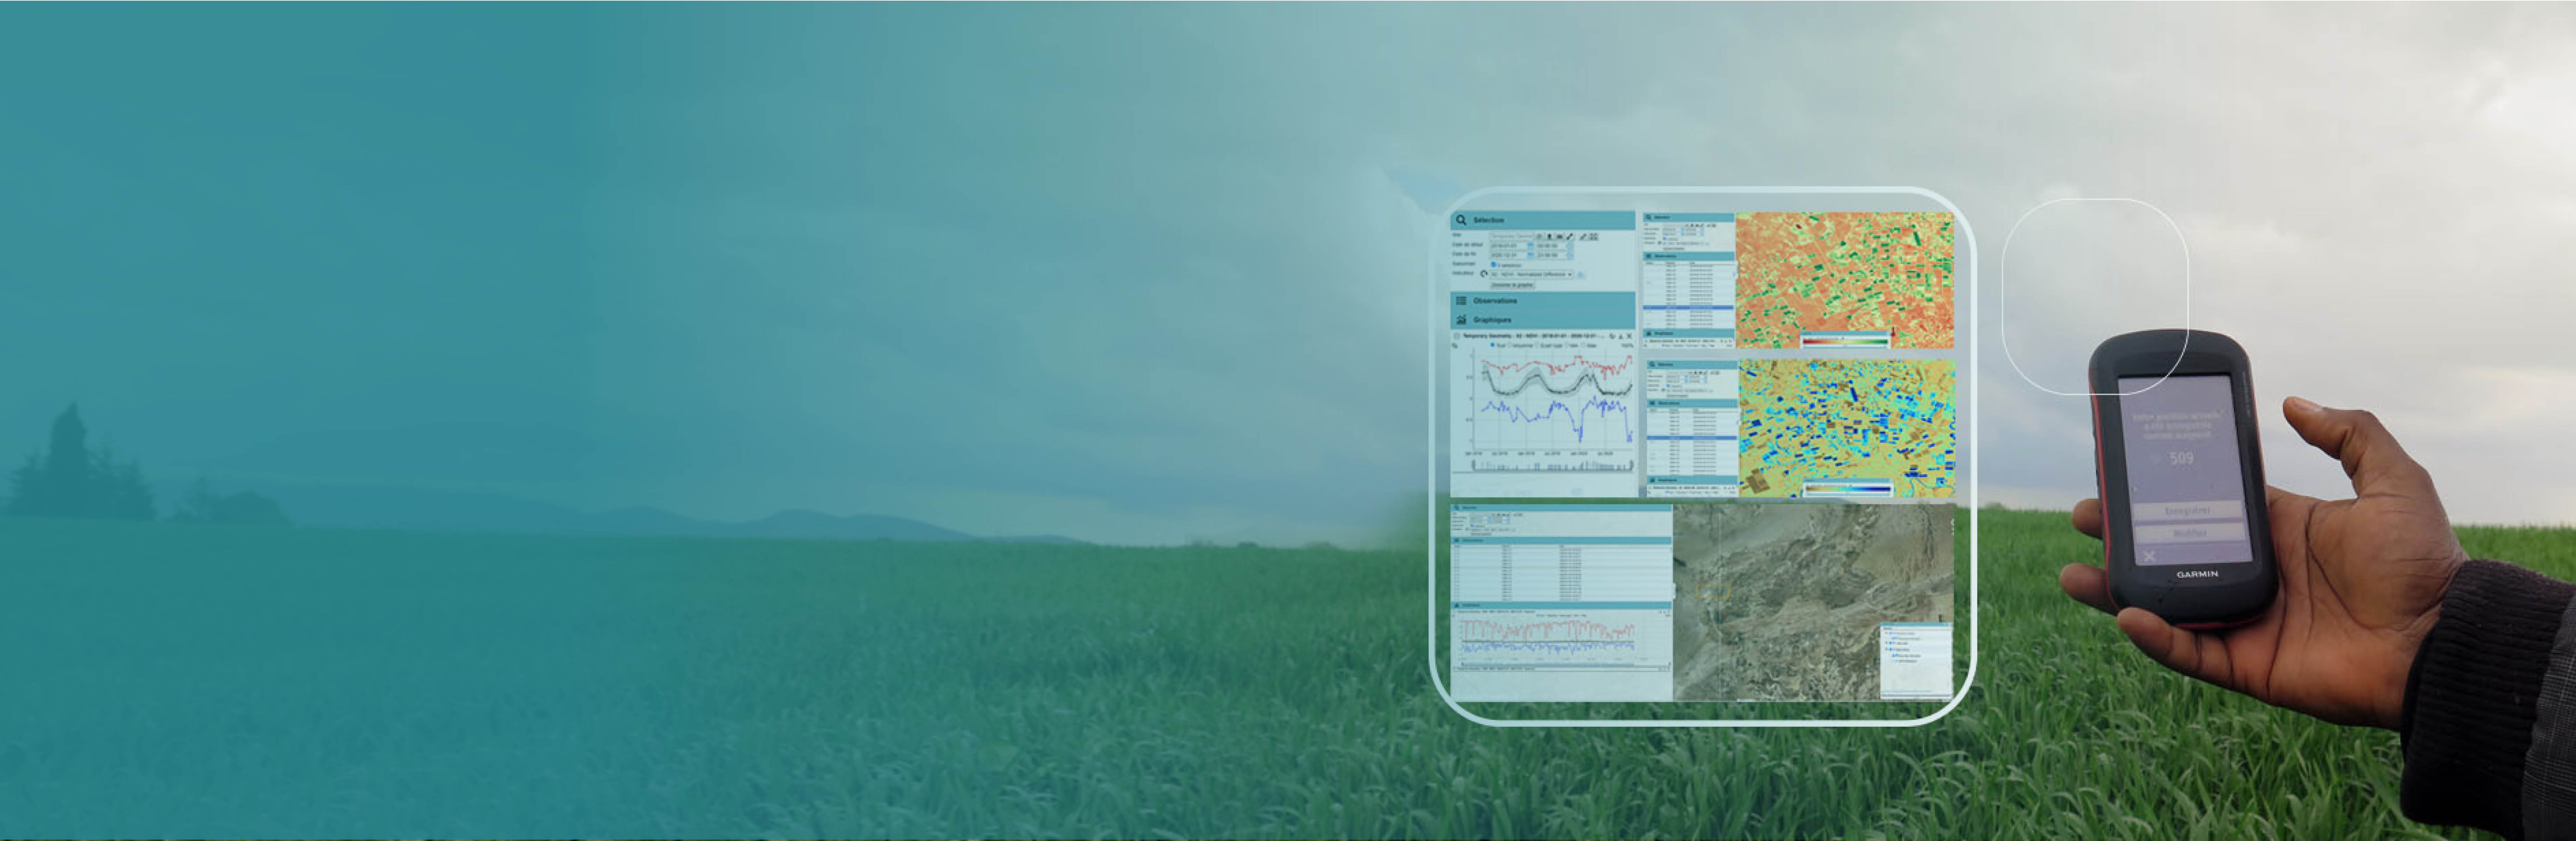
MISBAR for monitoring agricultural water use and seasonal agriculture
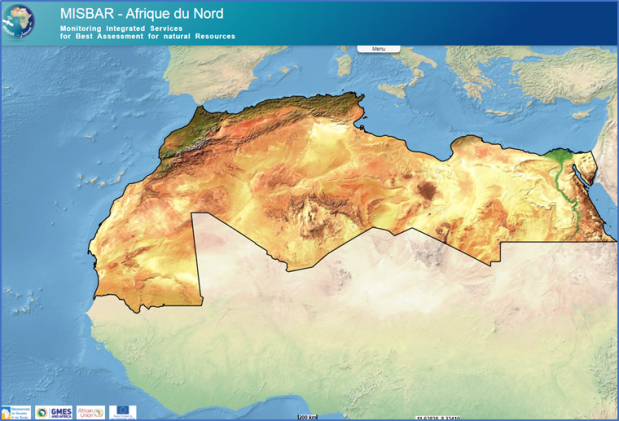
The Monitoring Integrated Services for Best Assessment of natural Resources (MISBAR) is an operational platform hosting resources of two of the operational services developed as part of the range of EO-based tools developed under the NA consortium project.
- Service 1 - Water abstractions monitoring
- Service 2 - Seasonal agriculture monitoring services
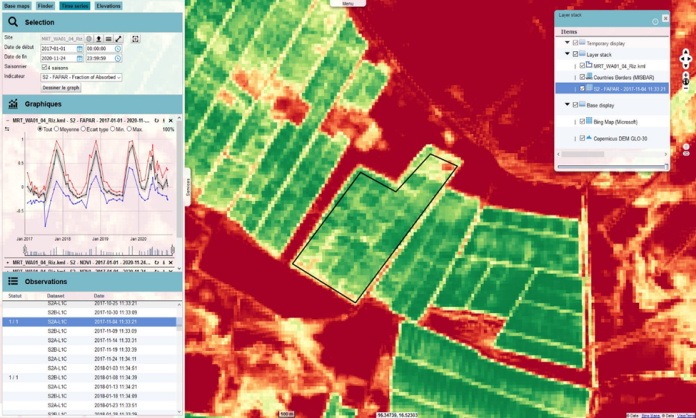
MISBAR provides a data processing relay functionality where EO data are collected from different sources (ESA, USGS, ECMWF, Copernicus, etc.), processed on the datacentre hosted in OSS premises, and made available through the web interface.
With MISBAR, end-users can find relevant answers to following questions:
- Where are located rainfed crops and/or irrigated crops?
- What are the growing condition and state of croplands?
- How are crops structured / performed?
- What is the causal relationship between crops, growth, and water resources availability and irrigation activities?
- What are crops water requirement?
- Which crop is undergoing water stress?
- Etc.
MISBAR provides a data processing relay functionality where EO data are collected from different sources (ESA, USGS, Copernicus, etc.), processed on the datacentre hosted in OSS premises, and made available through the web interface
MISBAR access link: http://misbar.oss-online.org
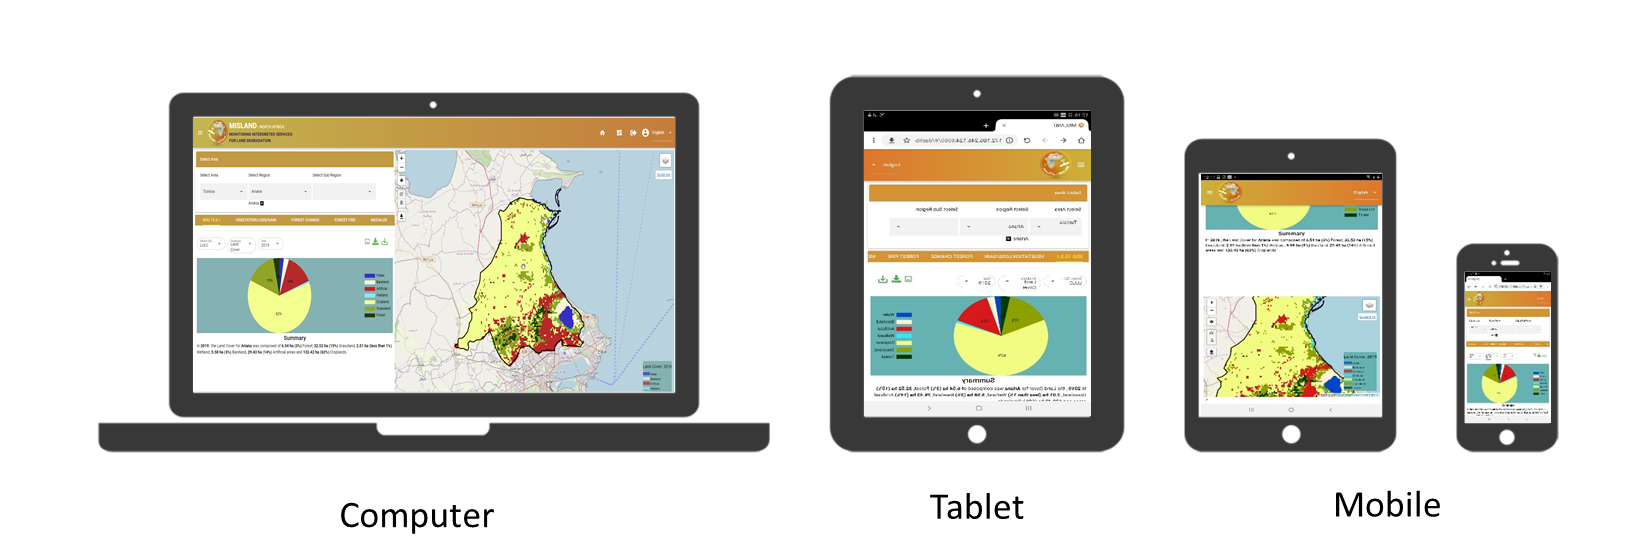
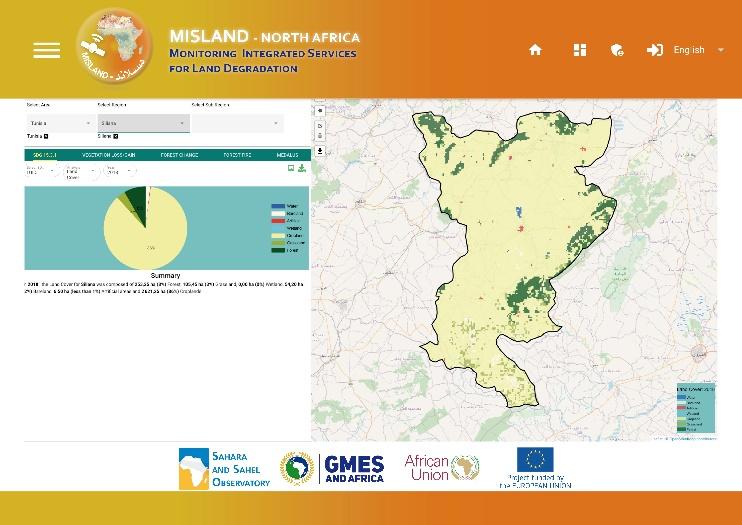
MISLAND for monitoring land degradation
The Monitoring Integrated Services for Land Degradation (MISLAND) is an operational platform hosting resources of the operational services for the monitoring of land degradation as part of the range of EO-based tools set up by the NA consortium project.

With MISLAND, end-users have possibility to interact, generate and collect geospatial information and resources on:
- SDG Indicator 15.3.1 with low, medium and high spatial resolution data (Landsat imagery) using the updated UNCCD best practices guidelines.
- Forest fires impact using (Landsat and Sentinel) burnt area assessed prior and after the fire occurrence.
- Vegetation loss and gain based on using indices (NDVI, SAVI & MSAVI2) adapted to climatic zones.
- Desertification vulnerability using Mediterranean Desertification and Land Use (MEDALUS) approach
- Assessment of forest carbon emissions
- Forest risk assessment
- Assessment of coastal erosion hotspots
- Land susceptibility to wind and water assessment
MISLAND relies on international standards for reporting the United Nation Convention to Combat Desertification’s SDG Indicator 15.3.1 which highlights the “Proportion of land that is degraded over total land area” and is supported by sub-Indicators:
- Land cover change, which provides a first indication of a reduction or increase in vegetation.
- Land productivity, which captures relatively fast changes in “greenness”.
- How are crops structured / performed?
- Carbon stock (above/below), which reflects slower changes in land resources health or condition
MISLAND access link: http://misland.oss-online.org
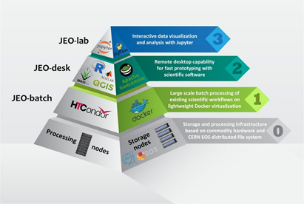
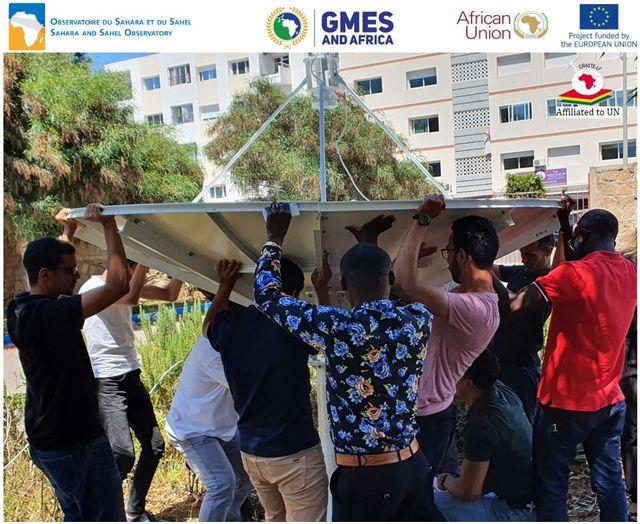
Three 3 eStations
In the framework of GMES&Africa, AUC had provided the North-African consortium with 3 eStations, installed in Algeria, Tunisia and Morocco.
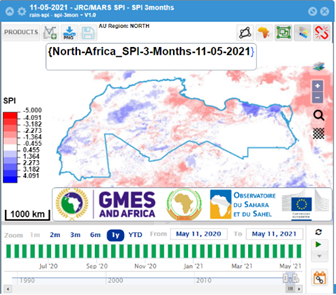
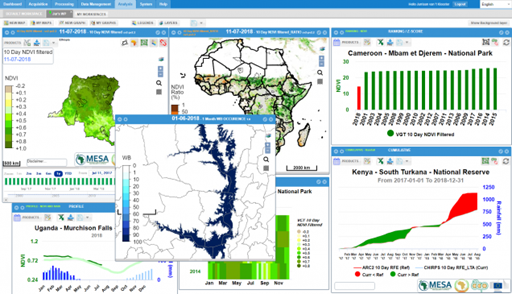
eStation is an Earth Observation processing system developed by the JRC since year 2009. It’s designed to automatically deal with the acquisition, processing, visualization and analysis of key environmental parameters derived from remotely sensed data.
In addition to the acquisition and processing services, the eStation offers a highly customized web application for analysis and visualization of the key environmental indicators. With as main features, the creation and saving of user workspaces that can contain multiple floating map windows and various types of time series graphs, linkable in time and space, and the creation of reusable user map and graph templates. Future developments will make all processing steps easily configurable, allowing the user to modify the generated environmental indicators and to implement new ones for computing ad-hoc thematic products. Its open source configuration encourages the community of end-users to customize the tools to their needs.
Dissemination platform
Mapping resources
Land Use Land Cover map covering North-African region at 10m resolution
Land use land cover is an essential input for creating a reliable environmental database. It represents crucial information, useful for managing natural resources and guiding decision-making processes.
To response to increasing, demand of LULC products in most the countries the consortium, the NA consortium has undertaken mapping projects at the scale of all the NA countries.
The project was implemented by OSS and has led to an updated map of the NA region, providing an up-to-date version of a LULC map and a view of the state of ecosystems at national and regional scales. This mapping project was possible due to availability and the free access of COPERNICUS resources which OSS support the promotion and the valorisation.
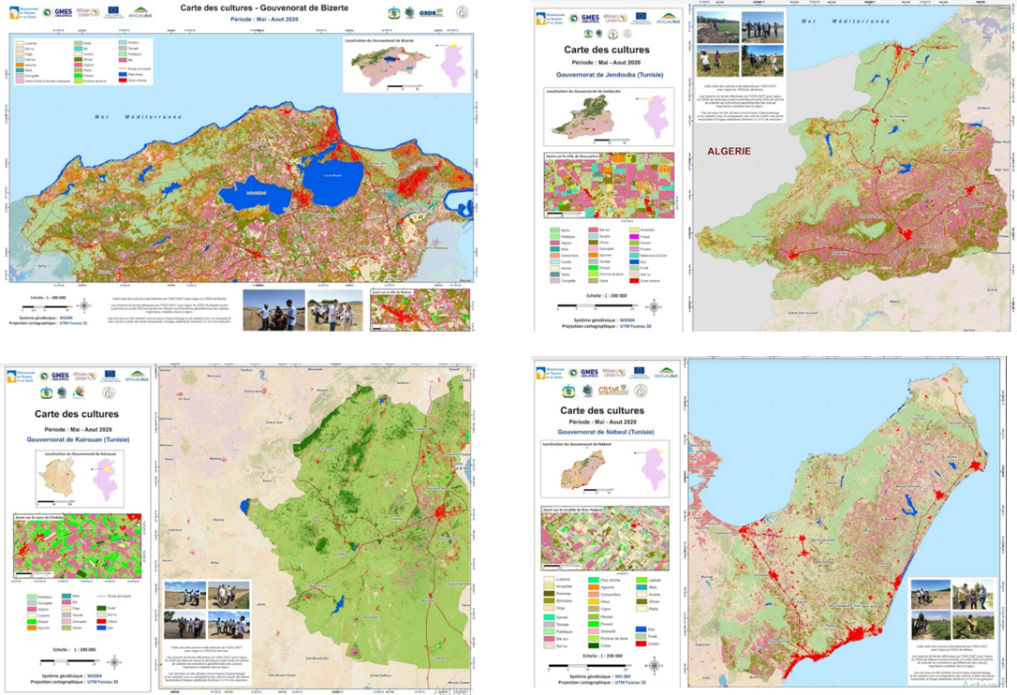
Crop mapping using time-series Sentinel-2 imagery
Detailed maps of crop types for the 2019-2020 agricultural season using time series of Sentinel-2 satellite images and in situ data collected with the support of national institution and with synergy with AfriCultuReS projects.
These seasonal crop maps produced at 10 m spatial resolution reflect the state of the agriculture campaign, including crops state and irrigated areas. They can be replicable each season by the establishment of field data collection process and end-users engagement.